Imagine being able to detect subtle patterns in Earth’s landscape using mathematical tools. With NASA’s API for obtaining LANDSAT Imagery and the Dynamic Mode Decomposition (DMD) technique, this becomes not only possible but accessible to anyone with enough curiosity and a reasonable understanding of python. Here are the highlights:
- LANDSAT Summary
- Accessing NASA’s API
- DMD Application
- Results & Interpretation
- Future Applications
LANDSAT Summary
Before diving into advanced methods for identifying patterns in the images we’ll analyze, it’s crucial to first understand the LANDSAT program and its broader significance. To do this I highly recommend this incredible video by NASA Goddard about LANDSAT 9. It’s an insightful and expertly crafted overview that will broaden your perspective.
So then what is LANDSAT? Well in short, LANDSAT is a series of Earth observation satellite missions, that are jointly managed by the United States Geological Survey and NASA.
Accessing NASA’s API
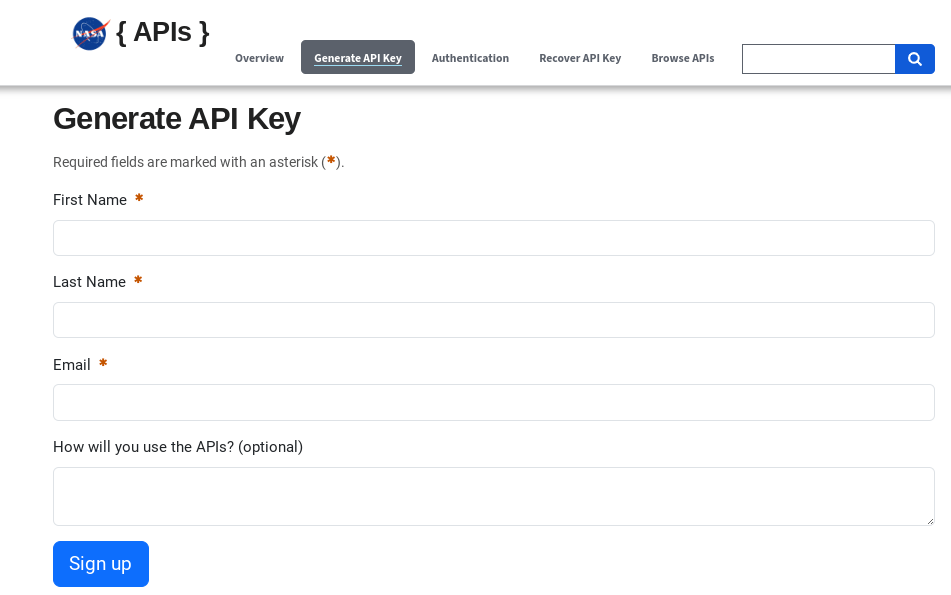
NASA has a range of powerful APIs to meet the need of space-related applications. In fact, NASA provides an Open API page, where you can easily generate an API key. To get started, click on the “Generate API Key” tab, which will take you to a page resembling the image below. Once you’ve completed this step, you will get an email (from noreply@api.data.gov) containing your newly generated API key. This key will be essential for using the API in scripts, such as generating LANDSAT 8 images.
Houston is called Space City because it’s home to NASA’s Johnson Space Center, whose latitude and longitude coordinates are (29.551811, -95.098228). To demonstrate how to use the API for generating images, we’ll begin by creating a single image of Houston, using the input coordinates. Let’s start by importing the necessary libraries to set up our workflow.
Importing Relevant Libraries
import numpy as np  # for matrix math--useful for DMD later.
from PIL import Image
import matplotlib.pyplot as plt  # used for viewing images
import requests
import io
API Key/DateLocation Info
api_key = "ENTER YOUR API KEY HERE"
#Latitude/Longitude coordinates for Houston, TX
lat, lon = (29.551811, -95.098228)
date = "ENTER THE DATE HERE (FORMAT YYYY-MM-DD)"
Next, we’ll use the requests module to send an HTTP request and retrieve the metadata for the image.
meta = requests.get(f"https:/api.nasa.gov/planetary/earth/assets?lon={str(lon)}&lat={str(lat)}&date={date}&dim=0.10&api_key={api_key}")meta.json()
The retrieved JSON metadata provides essential details about the images, including a URL, coordinates, and timestamps. Below is an example of what the JSON metadata should resemble for reference.
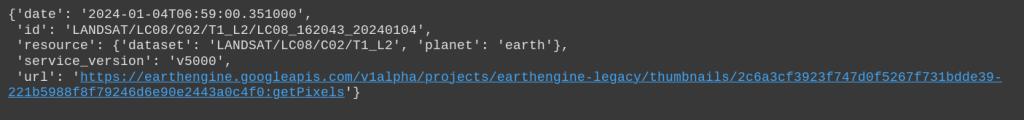
Notice there’s a specific URL designated for accessing the LANDSAT images itself. In the next step, we’ll utilize this URL to make a follow-up request and download the image for further processing.
Obtain Image
image = requests.get(meta.json()['url'])
imageStream = io.BytesIO(image.content)
imageFile = Image.open(imageStream).resize((1024,1024)), Image.Resampling.LANCZOS)
The Lanczos resampling algorithm is a sophisticated method for resizing images, enabling the generation of outputs with higher fidelity and enhanced sharpness. By interpolating the pixel values, this technique preserves fine details and minimizes artifacts, making it a preferred choice for high-quality image scaling.
Many resampling methods exist, such as Bilinear, Box, and Bicubic. Yet, the Lanczos method’s performance stands out, and is effective in applications demanding precision and clarity. If you’d like to explore the mathematical principles behind Lanczos interpolation, a linked video provides an in-depth explanation. For now, let’s implement the method in the next code cell to visualize its impact on image quality.
Show Image
plt.figure(figsize = (10, 10))
plt.axis('off')
plt.imshow(imageFile)
You will then view your Houston image, resembling the example provided below:
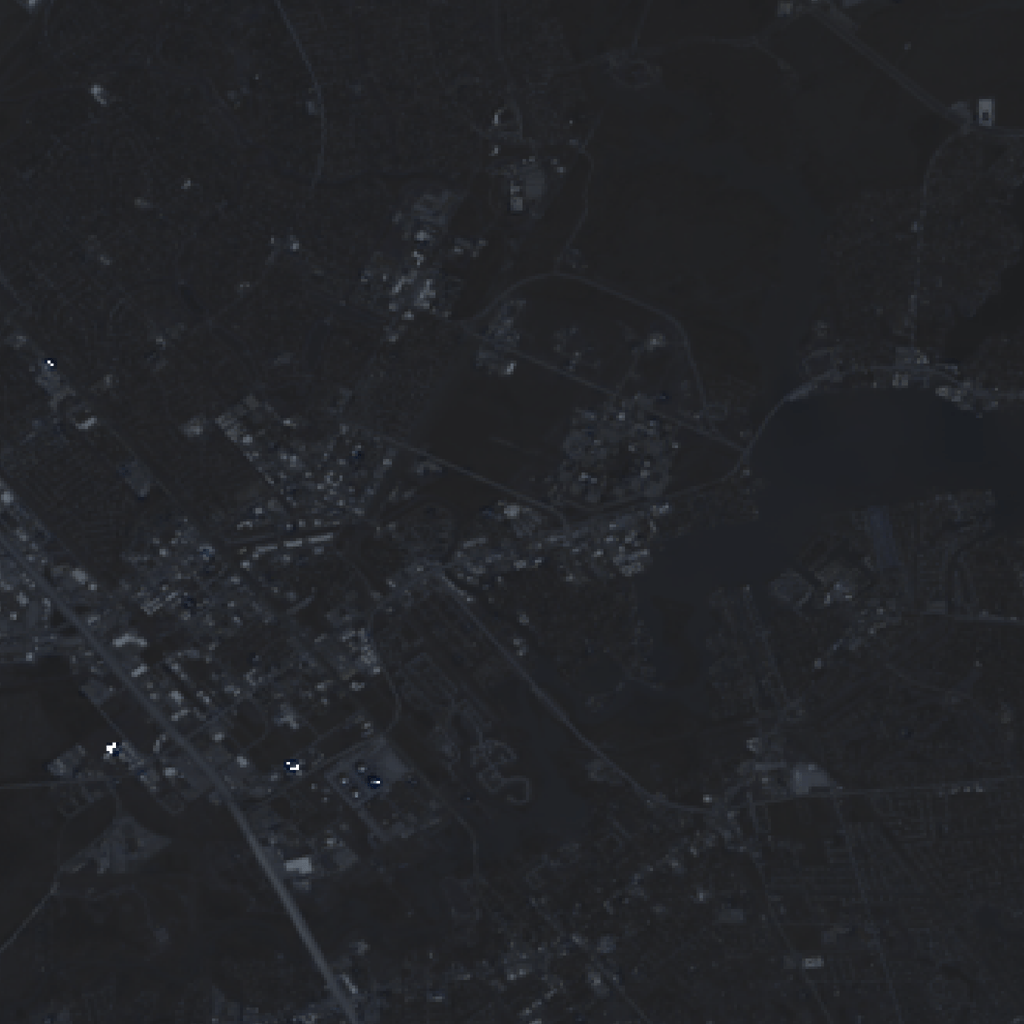
Notice the image here isn’t really that sharp. That’s because the API only supports pan-sharpened LANDSAT 8 imagery. Please stay tuned for alternate API use & clarification/application of DMD. The Jupyter Notebook is accessible in the BGecko Research Lab Github page.
